


![ELF 1 [主控:i.MX6ULL]](/storage/20230915/6504156616031.png)


搜索

GDB(GNU Project Debugger)是在Linux环境下功能全面的调试工具。它提供了一系列强大的调试功能,包括设置断点、单步执行、打印与观察变量、查看寄存器及堆栈信息等。在Linux软件开发的实践中,GDB被视为调试C及C++程序的核心工具,广泛用于帮助开发者定位和解决程序中的问题。
为避免符号解析错误或架构不兼容问题,用于远程调试的GDB应在版本上与开发板的工具链对齐。
elf@ubuntu:~/work/EDU/sdk/ELF2-linux-source$ ./build.sh bconfig
路径:
Toolchain 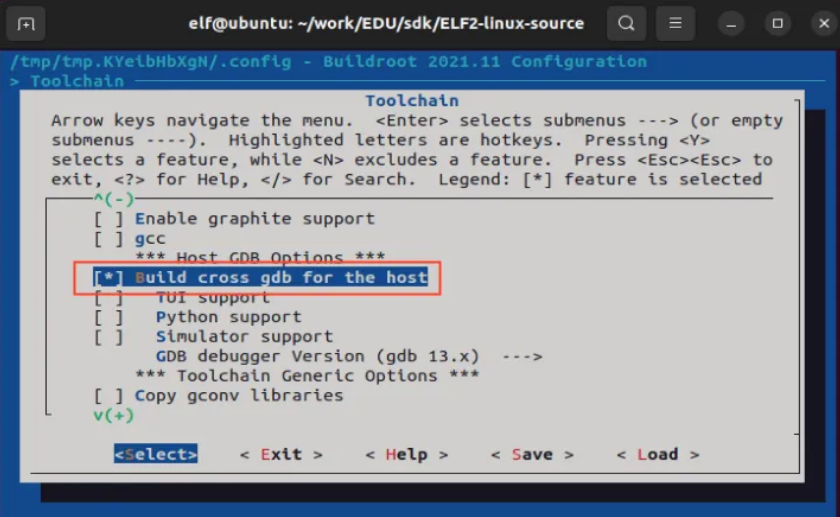
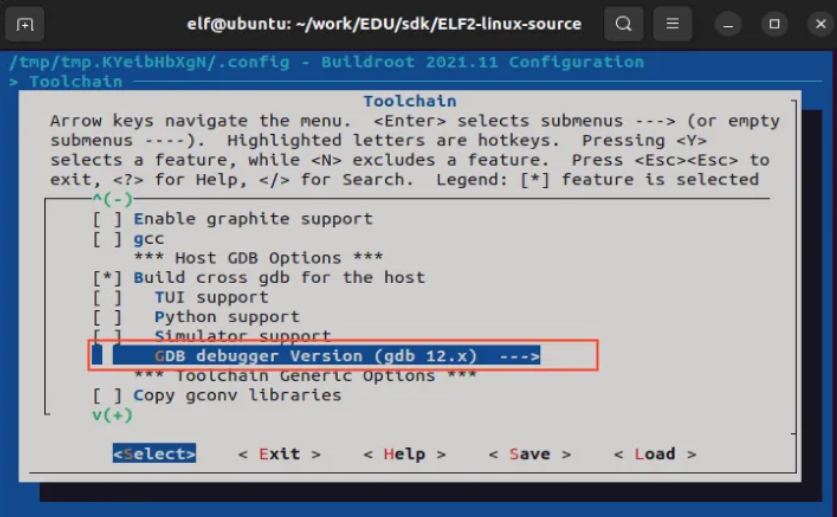
选择GDB版本,这里选择gdb12.x
elf@ubuntu:~/work/EDU/sdk/ELF2-linux-source$ ./build.sh bconfig
路径:
Target packagesDebugging, profiling and benchmark
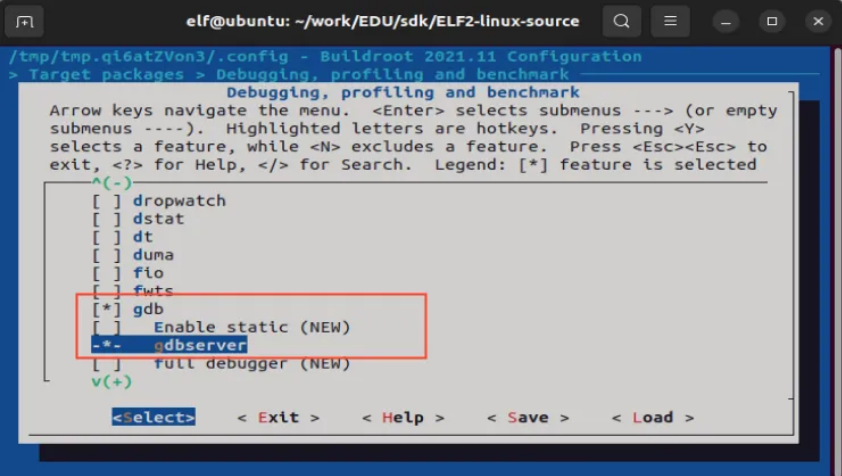
elf@ubuntu:~/work/EDU/sdk/ELF2-linux-source$ ./build.sh buildroot这样就可以将软件包直接编译到文件系统的镜像中了。
elf@ubuntu:~/work$ vi gdbdemo.c
例程代码如下:
#includeint main() {int a = 10;int b = 20;int sum = a + b;printf("a = %d, b = %d\n", a, b);printf("sum = %d\n", sum);for (int i = 0; i < 5; i++) {printf("Loop i = %d\n", i);}return 0;}
添加交叉编译器路径,进行交叉编译,编译要调试的应用程序:必须要加-g选项
elf@ubuntu:~/work$ export PATH=/home/elf/aarch64-buildroot-linux-gnu_sdk-buildroot/bin/:$PATHelf@ubuntu:~/work$ aarch64-linux-gcc -g gdbdemo.c -o gdbdemo
将编译生成的gdbdemo通过U盘拷贝到开发板上,比如/home/elf路径下,下述以U盘为例,拷贝到开发板。
root@elf2-buildroot:~# cp /mnt/udisk/gdbdemo /home/elf
root@elf2-buildroot:~# gdbserver 172.20.8.7:2345 /home/elf/gdbdemoProcess /home/elf/gdbdemo created; pid = 1314Listening on port 2345
GDB工具所在路径:
ELF2-linux-source/buildroot/output/elf2_fs/host/bin/aarch64-linux-gdb
elf:~/work$ ./EDU/sdk/ELF2-linux-source/buildroot/output/elf2_fs/host/bin/aarch64-linux-gdb gdbdemoGNU gdb (GDB) 12.1Copyright (C) 2022 Free Software Foundation, Inc.License GPLv3+: GNU GPL version 3 or later <http://gnu.org/licenses/gpl.html>This is free software: you are free to change and redistribute it.There is NO WARRANTY, to the extent permitted by law.Type "show copying" and "show warranty" for details.This GDB was configured as "--host=x86_64-pc-linux-gnu --target=aarch64-buildroot-linux-gnu".Type "show configuration" for configuration details.For bug reporting instructions, please see:<https://www.gnu.org/software/gdb/bugs/>.Find the GDB manual and other documentation resources online at:<http://www.gnu.org/software/gdb/documentation/>.For help, type "help".Type "apropos word" to search for commands related to "word"...Reading symbols from gdbdemo...(gdb) target remote 172.20.8.7:2345 //连接开发板Remote debugging using 172.20.8.7:2345Reading /lib/ld-linux-aarch64.so.1 from remote target...warning: File transfers from remote targets can be slow. Use "set sysroot" to access files locally instead.Reading /lib/ld-linux-aarch64.so.1 from remote target...Reading symbols from target:/lib/ld-linux-aarch64.so.1...(No debugging symbols found in target:/lib/ld-linux-aarch64.so.1)Reading /home/elf/work/EDU/sdk/ELF2-linux-source/buildroot/output/elf2_fs/host/lib/debug/.build-id/01/bd8db25550e790a84285a6377baa031748d93c.debug from remote target...0x0000007ff7ff1900 in _start () from target:/lib/ld-linux-aarch64.so.1(gdb)
此时就可以根据需求进行调试了,下面是几个常用的命令
(1)l:列出所有源代码
(2)b:设置断点
(3)c:运行到断点处
(4)s:单步运行执行
(5)n:单步执行,但是step会进入函数里面,但是next不会
(6)p a:打印a这个变量的值
(7)q:退出,输入此命令则开发板上的gdbserver也退出
下面以具体示例介绍参数的使用方法。
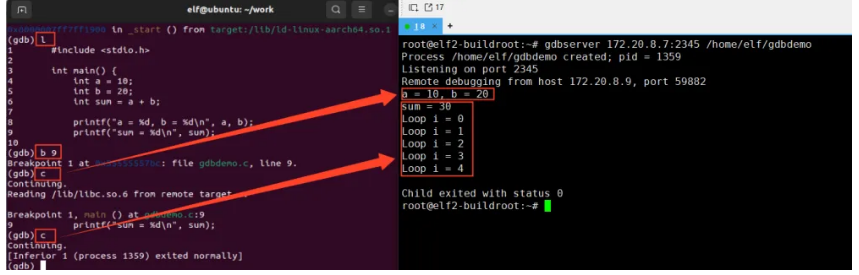
(gdb) l //列出源代码123int main() {4 int a = 10;5 int b = 20;6 int sum = a + b;78 printf("a = %d, b = %d\n", a, b);9 printf("sum = %d\n", sum);10(gdb) b 9 //在第9行设置断点Breakpoint 1 at 0x55555557d0: file gdbdemo.c, line 9.(gdb) c // 继续执行程序,直到遇到断点,此时终端打印a = 10, b = 20Continuing.Reading /lib/libc.so.6 from remote target...Breakpoint 1, main () at gdbdemo.c:99 printf("sum = %d\n", sum);(gdb) c //从当前断点继续执行到程序结束。Continuing.[](gdb)

![ELF 2 [主控:RK3588]](/storage/20241127/6746808ef36ed.png)
![ELF2_Lite [主控:RK3576]](/storage/20260105/695b71ecdd6ef.png)
![ELF-RV1126B [主控:RV1126B]](/storage/20260105/695b8a5bd7193.png)
![ELF-RK3506 [主控:RK3506B]](/storage/20260105/695b9a72f304d.png)
![ELF 1S [主控:i.MX6ULL]](/storage/20230915/650415d4d8d83.png)